


A perspective for the Caribbean Sea and Gulf of America by University of South Florida Optical Oceanography Lab (bbarnes4@usf.edu, yuyuan@usf.edu, huc@usf.edu)
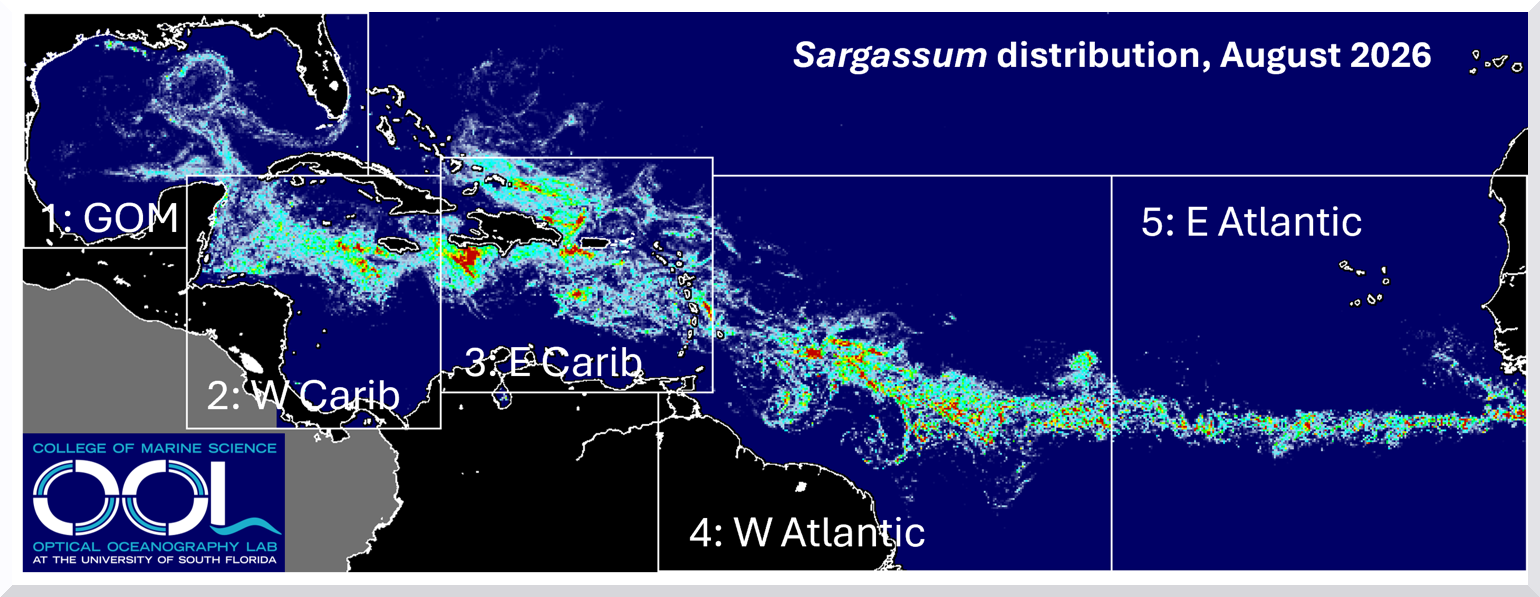
The map above shows the average Sargassum abundance for the month of August 2026, with warm colors representing higher abundance. The top color (red) indicates that 0.4% of the ocean surface is covered by Sargassum, meaning that Sargassum clumps and mats are scattered here and there in the location.
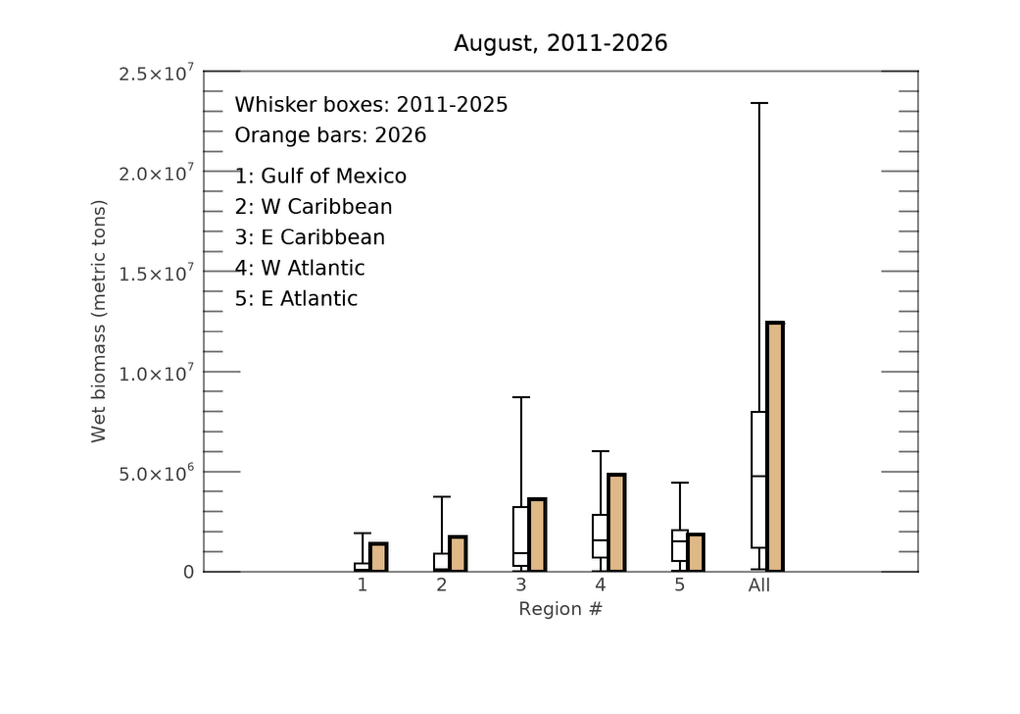
The Sargassum abundance for each region is compared with historical values in the same month of 2011–2025 in the whisker box plot below, where horizontal bars in each vertical box indicate minimal, 25%, 50%, 75%, and maximal historical values, respectively, for the month of August.
Consistent with all previous years, total Sargassum amount in every region continued to decline in July, while the distribution patterns remained stable with the Sargassum “belt” still stretching from the coast of West Africa to the Gulf. The total amount within the “belt” was halved, and the amount in the Gulf decreased to 1/3 of the July level.
However, total amount in every but the east Atlantic still exceeded the 75 percentiles of historical levels, suggesting that coastal inundation and beaching events in most regions continued in August, including the southeast coast of Florida and around the Caribbean and Lesser Antilles islands.
Looking ahead: Sargassum amount in all regions will continue to decrease in the coming months until possibly November. Meanwhile, beaching events around the Caribbean and southeast coast of Florida will continue, but not as severe as in the summer months. We will keep a close eye on whether there are anomalous changes in the coming months.
All previous monthly bulletins as well as daily imagery can be found under the Sargassum Watch System (SaWS). Meanwhile, high-resolution Sargassum maps for selected coastal regions are also available in near real-time under “Satellite Data Products => High Resolution” of the OOL Website.