A perspective for the Caribbean Sea and Gulf of America* by the University of South Florida Optical Oceanography Lab
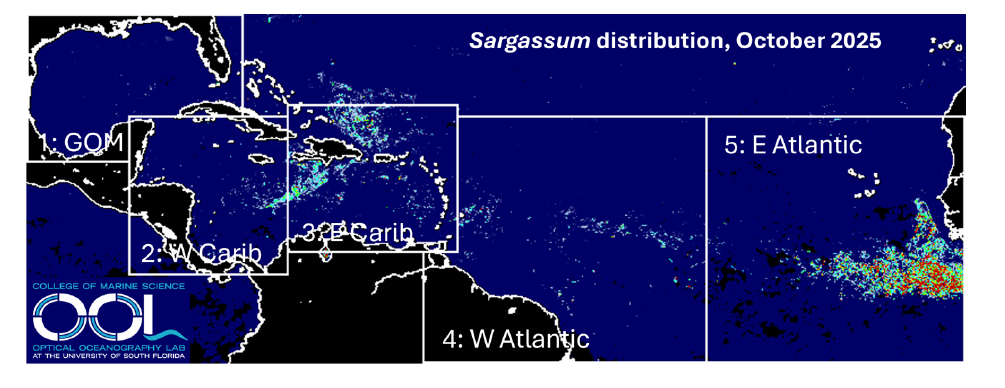
The map above shows the average Sargassum abundance for the month of October 2025, with warm colors representing higher abundance. The top color (red) indicates that 0.4% of the ocean surface is covered by Sargassum, meaning that Sargassum clumps and mats are scattered here and there in the location. The Sargassum abundance for each region is compared with historical values in the same month of 2011 – 2024 in the whisker box plot below, where horizontal bars in each vertical box indicate minimum, 25%, 50%, 75%, and maximal historical values, respectively.
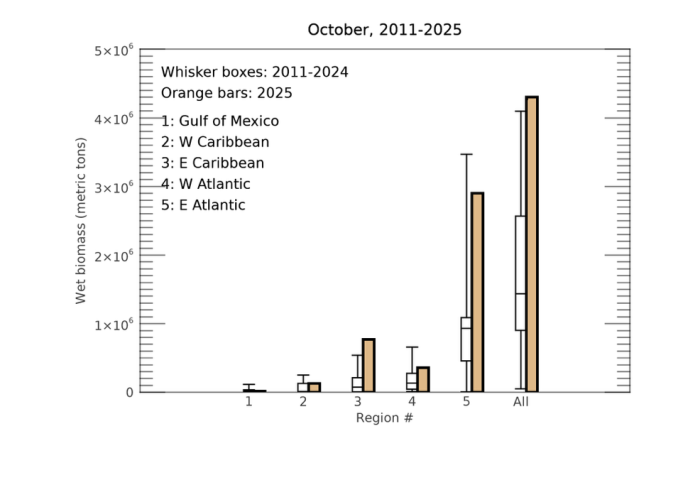
As predicted last month, the total amount of Sargassum in each of the five regions continued to decline in October. Similar to what happened in September, the decline in October was substantial in all but the East Atlantic region, with total Sargassum amount more than halved again. Most Sargassum is now in the East Atlantic, followed by the eastern Caribbean region. In the Gulf of America, Sargassum amount is now negligible (<0.02 metric tons). Despite such sharp declines, total Sargassum amount in the eastern Caribbean and West Atlantic still shows the highest in history for the month of October, but most of this biomass is around Dominica Republic and Haiti. Overall, the inundation pressure should have decreased substantially for all regions in October.
Looking ahead: Total Sargassum amount in all regions is likely to continue to decline, possibly reaching the annual minimum in November. Correspondingly, most regions should be free of massive inundations, as the Sargassum “season” is over. One possible exception is the East Atlantic, where the total Sargassum amount will likely remain relatively high even after further declines in November. All previous monthly bulletins as well as daily imagery can be found under the Sargassum Watch System (SaWS).
Meanwhile, we will keep a close eye on the temporal changes of Sargassum amount in all regions.